SmartSchool OS — AI-Powered School Operating SystemSmartSchool OS — AI-Powered School Operating System
FeaturesPricingAboutDocsSupport
LoginStart free
SmartSchool OS — AI-Powered School Operating SystemSmartSchool OS — AI-Powered School Operating System

One AI-powered operating system for school reports, exams, analytics, and growth — replacing spreadsheet chaos with clarity.

Start free

Product

  • Features
  • Pricing
  • Documentation

Resources

  • Get started
  • Support
  • About

Legal

  • Privacy Policy
  • Terms of Service

© 2026 SmartSchool OS. All rights reserved.

Powered by Globull

Documentation/AI features

Performance insights

AI analyses score trends across terms to surface students who are improving, declining, or at risk — with actionable intervention recommendations.
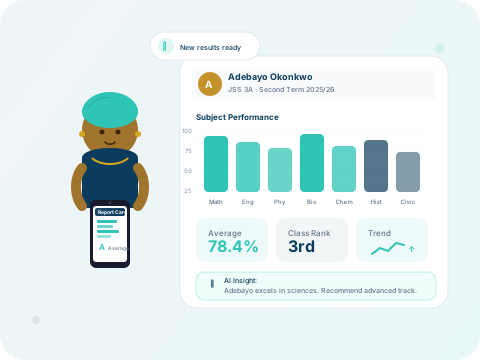
AI-powered performance insight charts and trends

Student performance analysis

AI categorises each student into one of three performance trajectories:

📈

Improving

Scores trending upward across subjects over recent terms.

➖

Stable

Consistent performance with no significant changes.

📉

At risk

Declining scores or repeated absences flagged for intervention.
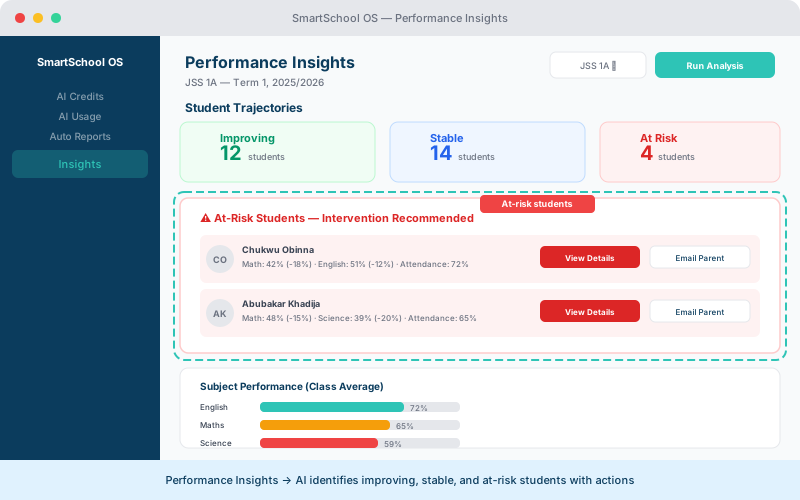
Performance insights showing student trajectories, at-risk alerts, and subject performance
AI categorises students as improving, stable, or at-risk — with actions for each.

Class-level insights

View aggregate performance patterns for any class:

  • Average scores across all subjects with term-over-term comparison.
  • Score distribution charts showing how many students fall in each grade band.
  • Subject-level breakdown highlighting strongest and weakest areas.
  • Attendance correlation — how attendance affects class performance.

Intervention recommendations

When the AI detects at-risk students, it suggests targeted strategies:

  1. 1Additional tutoring sessions for struggling subjects.
  2. 2Parent conference recommendations for persistent issues.
  3. 3Peer mentoring pairings based on complementary strengths.
  4. 4Study resource suggestions tailored to identified weak areas.

💡 Tip

Act on recommendations early in the term. Interventions applied in the first 3 weeks show the highest impact on end-of-term results.

Trend tracking

Compare performance across terms and sessions to measure the impact of teaching interventions and curriculum changes. The trend view places multiple periods side by side with percentage change indicators.


← Auto-generated reportsNext: AI usage dashboard →